GEO-Sense
Proximity Future’s GDPR compliant GEO-Sense application is a people counting footfall system specifically designed for use on the highstreet and retail environment. GEO-Sense provides anonymous information based on unique visitor numbers requiring no end user interaction.
Dedicated sensors gather anonymised data providing information on unique visitor counts which unlike traditional systems allows GEO-Sense to provide enhanced reports such accurate visitor numbers, dwell time, visitor movements and frequency of visits.
Place managers can access the anonymous data to gather insights on visitor behaviour, identifying areas of high and low footfall providing quantitative insights for future activities.
GEO-Sense footfall sensors utilise The Internet of Things (IOT) and be attached to a WiFi network or operate independently via a cellular connection. Designed and managed in house, the sensors detect the WiFi signal from mobile devices which is instantly anonymised and sent to our private cloud based network without any intervention by the visitors.
GEO-Sense is often used to provide intelligent data helping organisations to monitor highstreet footfall, measure the success of events and improve the visitor experience by ensuring areas do not get overcrowded.
Who uses GEO-Sense?
- Business Improvement Districts – BIDs
- Local and Borough Councils
- Retail Centres
- Theme Parks and Zoos
- Exhibition venues
- Music venues
GEO-Sense Reports
Unlike more traditional footfall counters such as cameras and beam-breakers, GEO-Sense only provides data on unique counts. Having a unique ID assigned to every visitor allows GEO-Sense to provide a wide range of specifically tailored manual or automated reports including counts on new or returning visitors, accurate dwell time information, identify how people move from one area to another and heat mapping to understand areas of less and greater interest.
For customers that subscribe to additional applications such as ElephantWiFi, Enviro-Sense or Parking-Sense we offer additional enhanced reports combining Footfall information with Vehicle Counting, Air Pollution and for users of ElephantWiFi we can also include anonymous demographic information such as gender, age groups and origin postcode data.
How is GEO-Sense used?
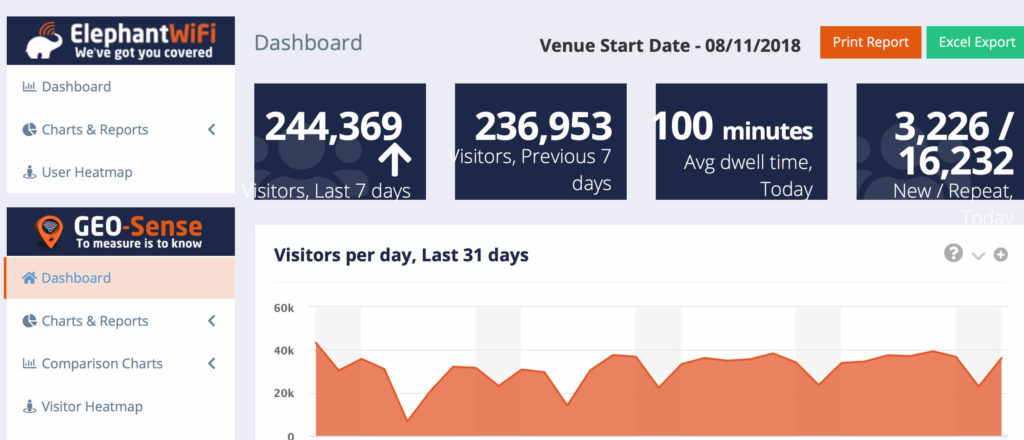
GEO-Sense can be used to measure and help make informative decisions using detailed information via the data, charts and reports provided.
The included charts and reports can be accessed anytime on any device via our secure browser based application, Intelli-Sense. This information helps provide for a more effective output and decision making by:
- Assessing event effectiveness
- Comparing footfall with past periods
- Monitoring key areas of town centres
GEO-Sense removes the need for guesswork enabling place managers to make decisions based on tangible and exact data.
“To Measure is to Know”
GEO-Sense FAQ
What is GeoSense?
GEO-Sense is a revolutionary footfall monitoring application that unlike traditional methods like beam counters or cameras, GEO-Sense uses WiFi to detect devices. GEO-Sense only listens and does not require any interaction from members of the public and is fully GDPR compliant. In simple terms, if WiFi is enabled on a device it will be counted unless we specifically ignore it due to it being a printer, speaker etc. By monitoring WiFi enabled devices we are able to enhance our data with statistics based on unique counts making the footfall numbers we provide far more accurate than any traditional methods. Our standard reports include information such as Dwell, Repeat Visitors, Journey Maps, Hotspots and a great deal more.
How does it work?
In very simple terms GEO-Sense listens for WiFi requests being made from devices and makes a note of them. It doesn’t offer a WiFi connection, only listens so there is no interaction required by users and as each device has its own unique ID we are able to provide statistics on individual devices making the data we provide extremely accurate.
Is it GDPR Compliant
Yes, The ICO deem the MAC address of a mobile device as personal information which is how to identify a device as unique. We MASK the MAC address as soon as it arrives on our servers and then MASK it again post midnight every day meaning the MAC address can never be recovered.
Is the data live?
Yes, we provide both historical reports going back to when the venue went live and also current day reports which shows live data with a latency of only 30 seconds. We also provide a dedicated event report which is live to 5 seconds which can be used for gate Entrance/Exit counting at large events.
How many people can have access to the reporting portal?
We do not limit the number of customers that have access to reporting portal as long as they are authorised by our primary contact.
How do I access it?
GEO-Sense reporting tools are available via our cloud based Intelli-Sense system. Accessible via any current browser and is completely mobile friendly. https://portal.intelli-sense.co.uk
Is there a limit to the number of sensors?
No, although we always recommend a minimum of 2 to ensure the Journey Reports work correctly.
If WiFi is off on the phone am I still counted?
Unfortunately not. GEO-Sense works by listening for WiFi network requests so if WiFi is switched off the device cannot be counted.
If I carry two phones am I counted twice?
Yes, although both phones may be owned by the same person they are seen as unique devices and therefore each one is counted. However when compared to traditional footfall systems, GEO-Sense is still far more accurate we only counts unique devices and do not multi-counted the same person as per beam or camera systems.
Where would sensors be installed?
Sensors need to be installed close to where you want to count footfall as each sensor has a range of approximately 100 mts. We offer two versions, network connected (Ethernet or WiFi) and 4G. The 4G version only requires a power source, both are designed to be mounted externally and are housed in an IP67 enclosure.
Does Proximity Futures install and maintain the sensors?
Yes, we can offer a complete package which includes site surveys, structural surveys, permission requests, electrical works and installation. Ongoing support is provided by ourselves via a dedicated team of support desk engineers which will include training, ongoing monitoring and hardware replacement if required.
Can the system be expanded at a later date?
Yes, we often get asked to add additional sensors at a later stage and our reporting tools allow for this by giving customers the ability to select or deselect zones that have been added at later stage for easy comparison or new or historical data.
GEO-Sense vs Traditional footfall counters
Traditional footfall sensors such as camera’s and beam breakers are incapable of identifying unique visitors and will continue to add to daily counts no matter how many times the same person is seen by a sensor. Quite often this will artificially increase actual footfall numbers by a considerable multiplier and doesn’t always relate to past trends as you can’t guarantee that the same number of people will always walk past a counter the same number of times within a given day. GEO-Sense operates differently by using an ID contained within a WiFi signal which is unique to each and every WiFi-enabled device. We then use this ID to create a unique entry in our database and continue to refer to it for the life of the system. Using the ID this way means we can create very accurate reports on total numbers of visitors, whether they are new to the location or not, dwell, journey reports and much, much more, none of which traditional footfall systems are capable of providing.

Our Data Solutions